I’ve been so spoiled throughout my years of building dashboards and data models in PowerBI and Excel… I didn’t realize it until recently, as I started taking on freelancing projects outside of work. I began the process of developing a PowerBI dashboard for an awesome new client, after touting my skills and experience to win the job. After importing the first set of data provided, I moved on to my typical next step of adding a Date Dimension table to the model.
Wait… I don’t have a DateDim table to import… What do I do now? In the past, I had always written a quick “Select * From” SQL statement to import the perfect date table from a database at work, that I had become accustomed to including in about every report I had created in the last 3 years. Obviously, I didn’t have that luxury while working for another client.
Can You Create a Dynamic Date Dimension Table in DAX or M?
I thought about my options:
- Create a full date table manually that would include the full date range in the data set provided by the client.
- That’s a time-consuming mission, and doesn’t do the client any good when they refresh their report to see the latest and greatest insights…
- Create a SQL table like the one I was used to.
- Why? Where? How would the client access it? That makes no sense.
- Find a way to create a dynamic date table using M or DAX, to adapt to the changes in the other data sets.
- I didn’t know where to start… Based on the title of this post, let’s hope I figured it out!
- Can this be done in PowerQuery / M? It seemed logical to me, based on other dynamic queries I had used.
- Or should it be done using DAX? The all-mighty Google quickly led me in this direction. Carry on!
Why do You Need a Date Dimension Table in Your Data Model?
Having learned the ins and outs of building three-dimensional models in PowerPivot before the release of PowerBI, there wasn’t really an option. If you wanted to report on any sort of time-series data, you’d better include a date dimension table, whether you had one table of data, or an entire database to include…
Microsoft has made things much more user-friendly as PowerBI (and PowerPivot) have evolved. If you’re working with a single table per dashboard, and your data has information for every date in the range, you may not NEED a date dimension table. It’s now very easy to group data by day, week, month, quarter, or year, and there are benefits to using the grouping tools provided, as opposed to using your own format from your custom date table.
For me, having a date dimension table in every report provides the following benefits:
- When reporting on multiple data sets based on similar dates, you need the date dimension table to provide the time-series axis for any chart or graph. If you think you’re going to filter your report by date range, you’d better have a clean set of dates that every table relates to!
- On a much more optional level, you can include any custom formatting or grouping in your datedim table that you’d like to display in your report. For example, “January 2020” takes up a lot of space on an X-Axis. I personally like to use “Jan 20” or just “Jan”, depending on how big of a range is being shown, either of which takes up less than half of the real estate compared to the full version that grouping provides.
That’s Great… How Do I Use DAX to Create a Date Table?
As I mentioned, I quickly found a solution on Google to create a dynamic date table for my new client. Unfortunately, that was over a month ago, and I have no idea which website I ended up “borrowing” the initial steps from… Regardless, I’m going to get you going with a pretty generic date dimension table that you can customize for any situation. I’m going to use PowerBI to demonstrate, but this can be used in PowerPivot in Excel if that’s your weapon of choice.
Let’s see… A quick test. Do you even know how to create a table in PowerBI without starting with the “Get Data” button?
Create a New Custom Table in PowerBI
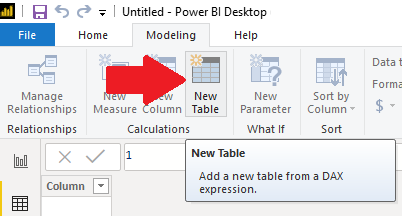
Instead of blindly following your instincts and clicking “Get Data”, click the Modeling tab. You’ve probably overlooked it a hundred times, but there’s clearly a button that says “New Table” staring you in the face. Click on it. Or Hover over it, and you’ll see that you can, “Add a new table from a DAX expression.” That seems like exactly what we want to do…
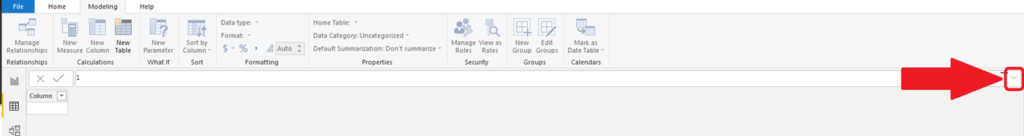
Now you just have a blank screen basically. What did you expect? Click the Arrow on the right side of the Formula Bar to expand the editor:
Tips for Writing Better DAX Code
The DAX editor in PowerBI does provide good Intellisense, and will help you identify any errors. Here are a couple of other handy ways to craft your DAX code:
- https://www.daxformatter.com/ – I’ve honestly never used this tool, but literally every person that I’ve discussed DAX with has pulled it up during our discussion. I figured I would share it, in case you’re reading this from under your rock. You can quickly copy and paste your DAX code into the website, and it will spit out a perfectly formatted version for you. It’s nice to keep your code clean for your own benefit, for those who need to interpret your work at some point, and it will help you easily identify typos/errors.
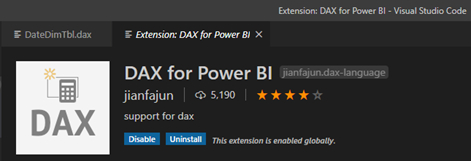
- DAX for Power BI extension for VSCode – I have gotten too comfortable with VS Code. I had never been big on code/text editors, but Microsoft has got me with this one… It’s so fast and easy to switch between files that are using different languages. It’s free, it runs on almost any system, comes equipped with intelligent code completion for 50+ languages, has tons of open source extensions, has SCM tools integrated, and allows you to interact with a terminal right in the window! Only recently did I discover the extension below that does a pretty darn good job of highlighting and autocompleting your DAX expressions (you can even see my DateDimTbl.dax file that I’m using to write this post). I don’t think you can do anything with a .dax file extension, but it’s a useful way to create and edit your DAX statements, especially if you want to save them for future use.
Okay, Fine… I Really Only Want to Know How to Build a Date Dimension Table Using DAX…
If you stuck it out this long, you earned it. Like a column or measure, start by naming the table you’re creating followed by a Space and an equals sign. I usually use DateDim. You can use spaces or most special characters in the name, if you must.
Once you’ve come up with an ultra-creative name, the first function to begin creating your table is ADDCOLUMNS. Your basic framework for creating a table should look like this:
DateDim =
ADDCOLUMNS (

)
To generate the date table, you’re really just going to dynamically populate (or you can set fixed dates) one column with dates that span the range that you define. To do so, use the CALENDAR function. The only arguments you need to provide are a start and end date. It can cause some ugly issues if you include dates that are not included in the other data sets that you’ll be linking to the date table, so try to set up the range of your Date column based on what you know about your other data.
In my example, I would be using a SQL query to fetch the data, and I know that the earliest date included is 01/01/2020, so I hard-code that in as my start date. The format is similar to SQL (if that helps), with the 4 digit year, two digit month, and two digit day/date, separated by dashes, and surrounded by Quotes; “2020-01-01”. Since my SQL query will be fetching data from days in the future, and I want the report to be “refreshable”, I want to be sure that the maximum date in the DateDim table is equal to (or greater than) the latest date in my other data sets. Assuming I have already imported another table called dataTable into the PowerBI file, with a date field called Date, I’ll use the LASTDATE function as my second argument in the CALENDAR function (maximum date). Similarly, the FIRSTDATE function would reference the earliest date in the field. So far, we have enough of a DAX statement to create a one column date table (almost). You need to include at least one defined column in the ADDCOLUMNS function, or you’ll get an error. Let’s get it started with a common date column called DateInt. Try to run the following code to generate a Date column and a DateInt column in your new table:
DateDim =
ADDCOLUMNS (
CALENDAR ("2020-01-01", LASTDATE(dataTable[Date])),
"DateInt", FORMAT ( [Date], "YYYYMMDD" )
)
The simple statement above will generate a fully functional date dimension table. From this point, it’s up to you to add as many additional columns with whichever formats you will want to utilize in your report. DAX is very useful for time-series reporting, and includes a bunch of useful date formulas.
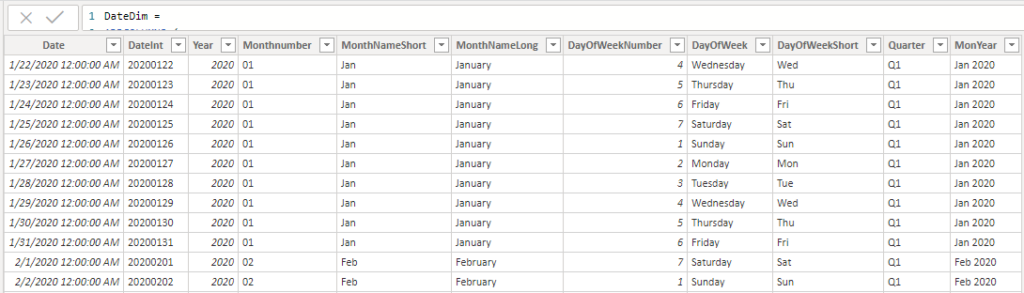
It’s pretty easy to create a column with the date in any format that you are looking for. By using capitalized and lowercase letters (Y, M, D, Q), you can quickly add your favorite date format for reporting. Here is a full DAX statement to create a very usable Date Dimension table. It includes several examples that should give you enough info to be able to generate whatever you’d like, including my favorite, MonYear.
DateDim =
ADDCOLUMNS (
CALENDAR ("2020-01-01", LASTDATE(data[Date])),
"DateInt", FORMAT ( [Date], "YYYYMMDD" ),
"Year", YEAR ( [Date] ),
"Monthnumber", FORMAT ( [Date], "MM" ),
"MonthNameShort", FORMAT ( [Date], "mmm" ),
"MonthNameLong", FORMAT ( [Date], "mmmm" ),
"DayOfWeekNumber", WEEKDAY ( [Date] ),
"DayOfWeek", FORMAT ( [Date], "dddd" ),
"DayOfWeekShort", FORMAT ( [Date], "ddd" ),
"Quarter", "Q" & FORMAT ( [Date], "Q" ),
"MonYear", FORMAT ( [Date], "mmm" ) & " " & FORMAT ( [Date], "YYYY" )
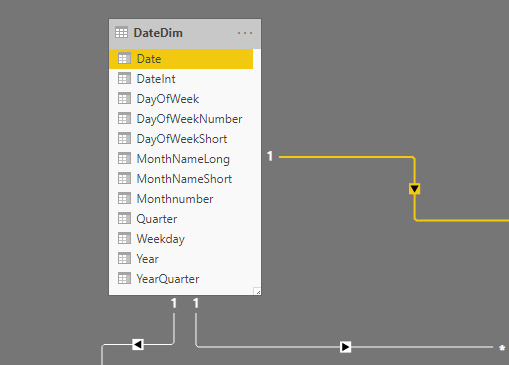
)Here is what the table looks like once it’s populated:
Hopefully that helped get you going in the right direction! Feel free to use the DAX statement above to create your Date Dimension table in your PowerBI report. After all, I found it the same way! That’s how we all learn… Good luck!
Please leave any questions or comments below. Come back again for another long article to read through with the code at the bottom that you want to use.